|
RESULTADO DE LAS ELECCIONES GENERALES 2004 Y 2008 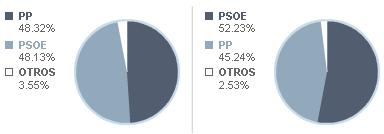 | | 2008 | 2004 | | | Partidos | Votos | Porcentaje | Diputados | Votos | Porcentaje | Diputados | | | PP | 245 | 48,32 % | - | 233 | 45,24 % | - | | PSOE | 244 | 48,13 % | - | 269 | 52,23 % | - | | IU | 6 | 1,18 % | - | 6 | 1,17 % | - | | PCPE | 2 | 0,39 % | - | 1 | 0,19 % | - | | E-2000 | 2 | 0,39 % | - | - | - | - | | P.S.D. | 1 | 0,20 % | - | - | - | - | | PFyV | 1 | 0,20 % | - | - | - | - | | TC | 1 | 0,20 % | - | - | - | - | | PACMA | 1 | 0,20 % | - | - | - | - | | TC-PNC | - | - | - | 1 | 0,19 % | - | | | FE | - | - | - | - | - | - | | ES2000 | - | - | - | - | - | - | | PADE | - | - | - | - | - | - | | PH | - | - | - | - | - | - | | PLN | - | - | - | - | - | - |
| | 2008 | 2004 | | Censo Electoral | 607 | 631 | | Votantes | 509 | 517 | | Abstenciones | 98 | 114 | | Participación | | | | Blancos | 4 | 0,79% | 5 | 0,97% | | Nulos | 2 | 0,39% | 2 | 0,39% |
|
